![]()
Chapter IV
The Igneous Rocks of the Mogok Stone Tract
A Ph.D. Dissertation by Kyaw Thu
Department of Geology, University of Yangon, Myanmar
Copyright © Kyaw Thu, 2007
Introduction from Bill Larson, Pala International
Kyaw Thu is a FGA gemologist with a Ph.D. in Geology. Pala International knows him from trips in the mid-1990s as one of the most interesting young gem enthusiasts, among so many wonderful students and collectors we met. Both Will and Bill Larson consider him a special and close friend. He has helped answer many questions regarding locality information for Brendan Laurs of GIA as well as meeting in person Dr. George Harlow of the American Museum of Natural History and corresponding with him for almost a decade. He has opened a gem laboratory and has applied to GIA to further his education. I was given a copy of his PhD thesis last month and Dr. Harlow made it available by scan for interested parties. Pala International is honored to share this with our readers.
Contents
See full table of contents here.
Chapter IV Petrochemistry
4.1 Analytic Data
4.2 Presentation of Analytical Data
4.3 Petrogenetic Interpretations
4.3.1 Nature and Chemical Changes in Igneous Differentiation
4.3.2 Conditions of the Crystallization of the Igneous Rocks
References
List of Figures (images from Pala International are not listed) |
|
| 4.1 | Sample location map of the Mogok Stone Tract (source; Landsat TM image, 30m resolution, band combination 754) |
| 4.2 | Variation diagram of major elements vs SiO2 in igneous rocks of the study area (cont.) |
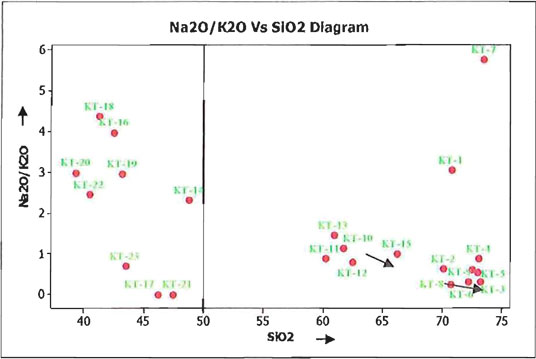
| 4.3 | Na2O/K2O vs SiO2 variation diagram, showing the trend of differentiation (KT-1 to KT-9 are granitic rocks/KT-10 to KT-15 are syenitic rocks and KT-16 to KT-23 are mafic to ultramafic rocks) |
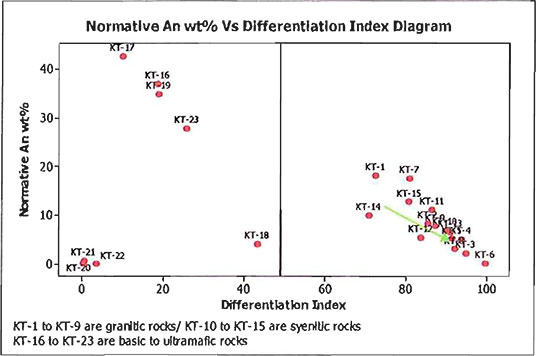
| 4.4 | Percent anorthite in normative plagioclase plotted against the Thornton-Tuttle differentiation index (KT-1 to KT-9 are granitic rocks/KT-10 to KT-15 are syenitic rocks and KT-16 to KT-23 are mafic to ultramafic rocks) |
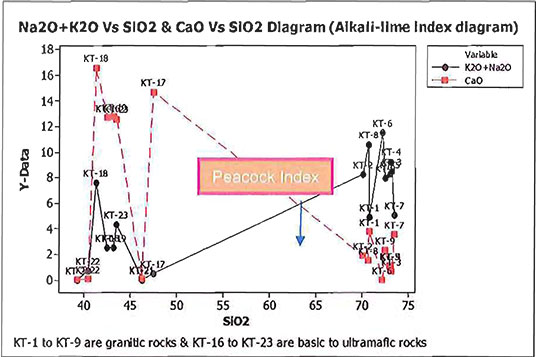
| 4.5 | Alkali-lime index diagram for granitic, syenitic, basic and ultramafic rocks (Peacock index) |
| 4.6 | Alkali-lime index diagram for granitic, basic and ultramafic rocks (Peacock index) |
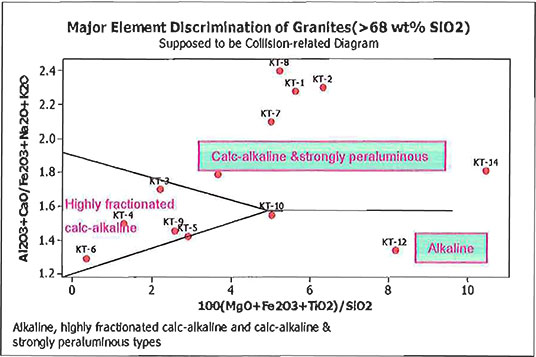
| 4.7 | Major element discrimination of igneous rocks supposed to be collision-related, subdivided as alkaline, calc-alkaline and strongly peraluminous, and highly fractionated calc-alkaline (after Sylvester, 1989) |
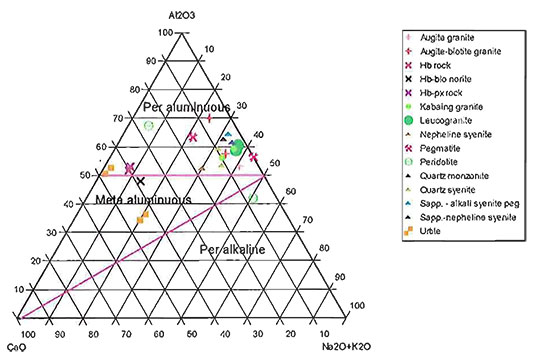
| 4.8 | Al2O3 — CaO — (Na2O+K2O) diagram |
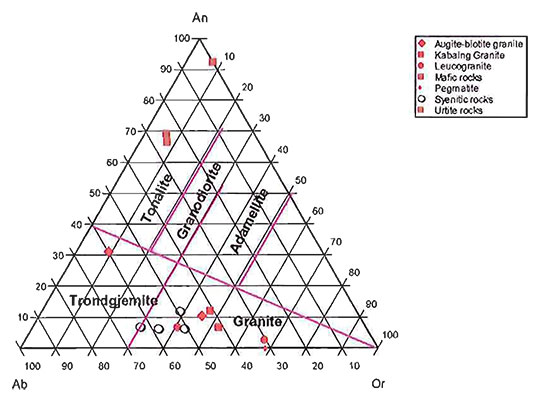
| 4.9 | Normative Ab-Or-An diagram for the igneous rocks of the study area, with dividing lines according to O’Connor (1965) |
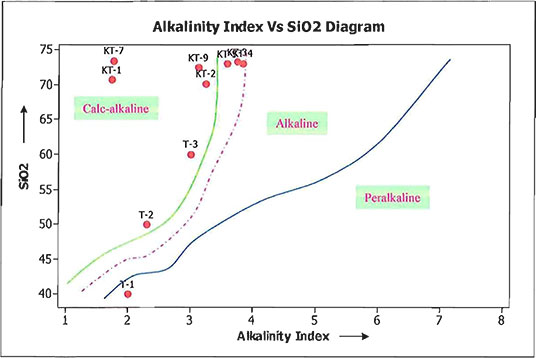
| 4.10 | Plot of Wright’s (1969) alkalinity index Al2O3+CaO+Na2O+K2O/Al2O3+ CaO-Na2O+K2O solid line and field names are after Wright, and the dashed line, separates alkaline from calc-alkaline, after Khin Zaw (1986) |
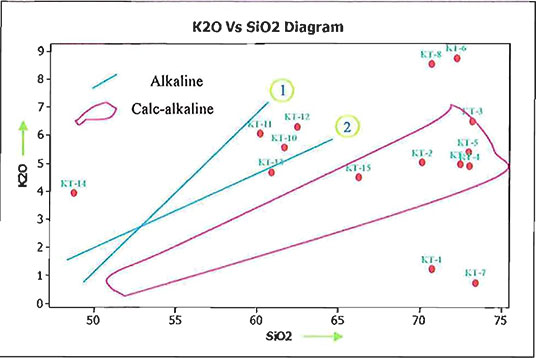
| 4.11 | Diagram showing K2O vs SiO2 wt % ration for granitic rocks and syenitic rocks of the study area Calc-alkaline – Jake and Gill (1970) Alkaline (1) – Gried and Lefeure (1972) Alkaline (2) – Lemoitre (1962) |
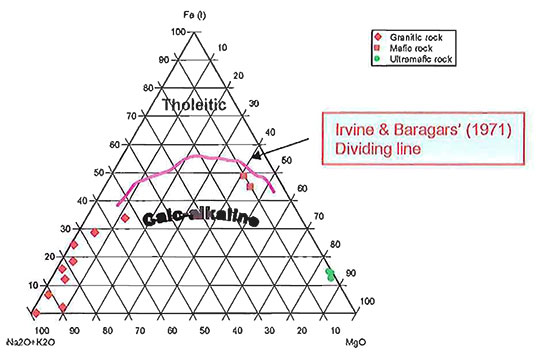
| 4.12 | Fe(t)-Na2O+K2O—MgO (AFM) diagram, in terms of alkalis, total Fe and Mg for the igneous rocks of the study area |
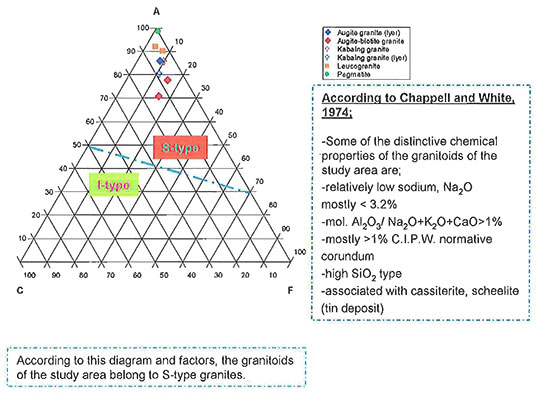
| 4.13 | ACF diagram for the granitoids of the study area (after Hyndman, 1985); Molar ratio: A = Al2O3-Na2O-K2O, C = CaO, F = Fe2O3+MgO |
| 4.14 | K2O-Na2O-CaO diagram |
| 4.15 | General Ca – Na – K compositional difference between the main kinds of alkaline igneous rocks; rocks become more mafic rich towards the Ca corner of the diagram (after Hyndman, 1985) |
| 4.16 | SiO2-(Na2O+K2O) – (FeO(t)+MgO) diagram |
| 4.17 | SiO2-Na2O-K2O diagram |
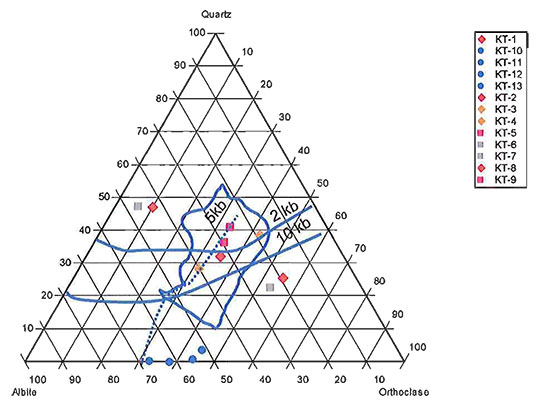
| 4.18 | Normative Qt-Ab-Or-H2O ratios of igneous rocks from the study area. Diagram showing H2O saturated liquidus field boundaries and isobaric temperature in the system Qtz-Ab-Or-H2O for various water pressures (after Tuttle and Bowen, 1958) |
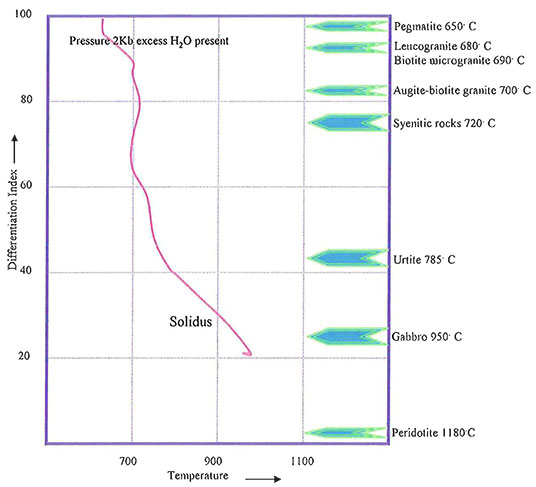
| 4.19 | Temperature – differentiation index diagram for the igneous rocks of the study area, at 2 kb water pressure (after Piwinskii and Wyllie, 1970) |
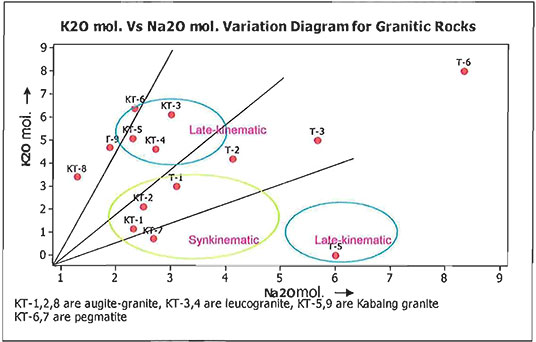
| 4.20 | K2O mol. vs Na2O mol. variation diagram of granitic rocks in the area, showing the fields of syn-kinematic and late-kinematic granites (after Marmo, 1956) |
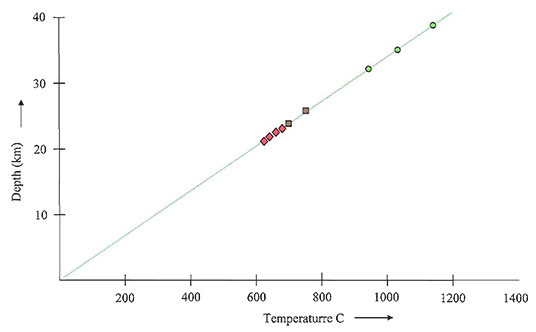
| 4.21 | Schematic depth-temperature relation diagram (after Marmo, 1969) |
List of Tables |
|
| 4.1 | Chemical composition and norms of the igneous rocks from the Mogok are (in wt%) |
Chapter IV Petrochemistry
4.1 Analytic Data
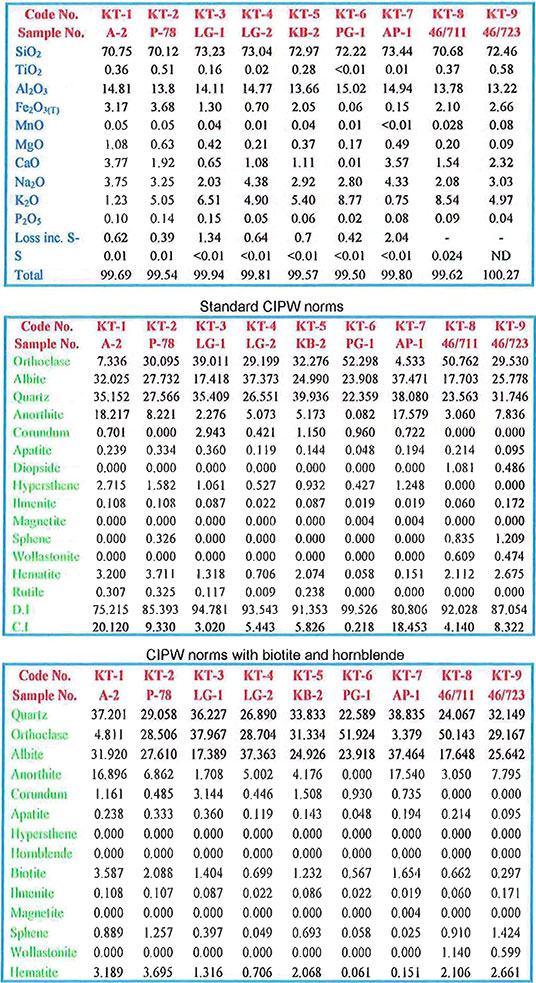
Representative 15 rock samples were selected for analysis, from some common rock types of the study area. Fresh rocks of 1 to 2 lb were crushed using a Sang WC mill crusher, and finely powdered to 300 mesh, using a Katie McGoldrick (X-RF sample preparation method).
Whole rocks geochemical analysis was performed by a wavelength dispersive X-RF spectrometer, using standard calibration method according to Robinson (Analyst), at the University of Tasmania, Australia. The results give Fe2O3 as total iron, and comparison with international and L.A.N. Iyer (1953) data are listed in Table 4.1.
4.2 Presentation of the Analytical Data
The weight-percent oxide method, molar-percent and normative-percent methods diagrams were drawn by using the aid of computer (MINITAB-14 GC software) in the present study. Standard C.I.P.W. norms and C.I.P.W. norms with biotite and hornblende were calculated according to the rules of Hutchison (1975), by the use of computer. Differentiation indices, which are also known as “Thornton and Tuttle index,” 1960, which can be used as an indicator of bulk composition, are calculated from the standard C.I.P.W. norms. The results are shown in Table 4.1.
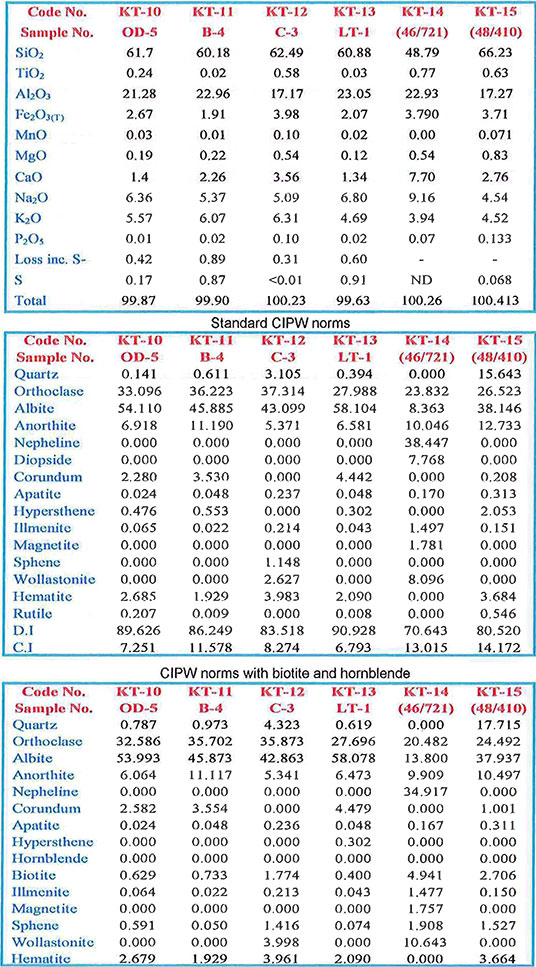
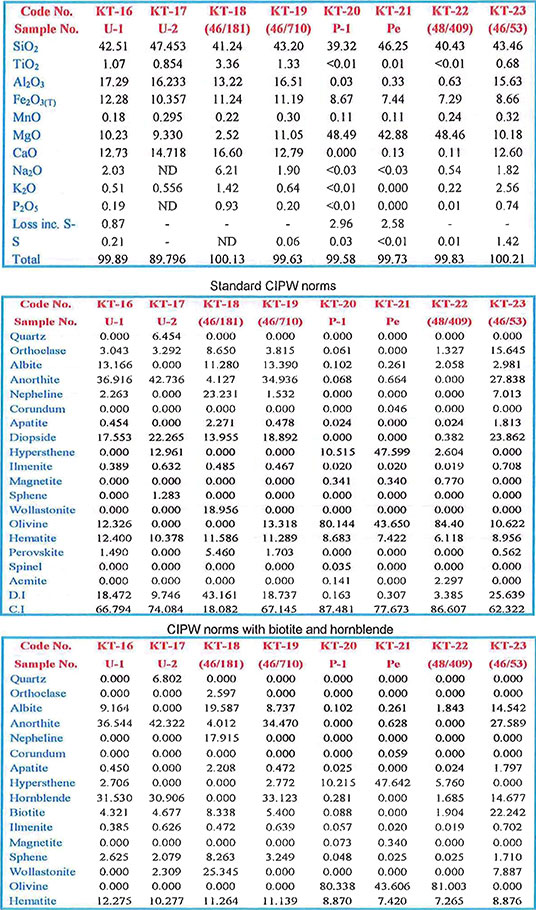
It can be noted from Table 4.1 that the various rock types analysed generally have the common petrochemical characteristics of similar typical rock types. For instance: syenitic rocks have high Al2O3 and alkali contents; leucogranites have high SiO2 and K2O, but lower content in feromagnesium; mafic and ultramafic rocks have high Fe2O3(T) and MgO contents; nepheline rich rocks have high CaO, K2O and Na2O contents. In general, it can be said that in modal composition of syenitic rocks, mafic and ultramafic rocks correspond to C.I.P.W. norms with biotite and hornblende. For instance; nepheline syenite and alkali syenite pegmatite have high corundum contents; quartz syenite has high sphene contents; urtite and gabbro have high plagioclase and hornblende; peridotite has high hypersthene (orthopyroxene).
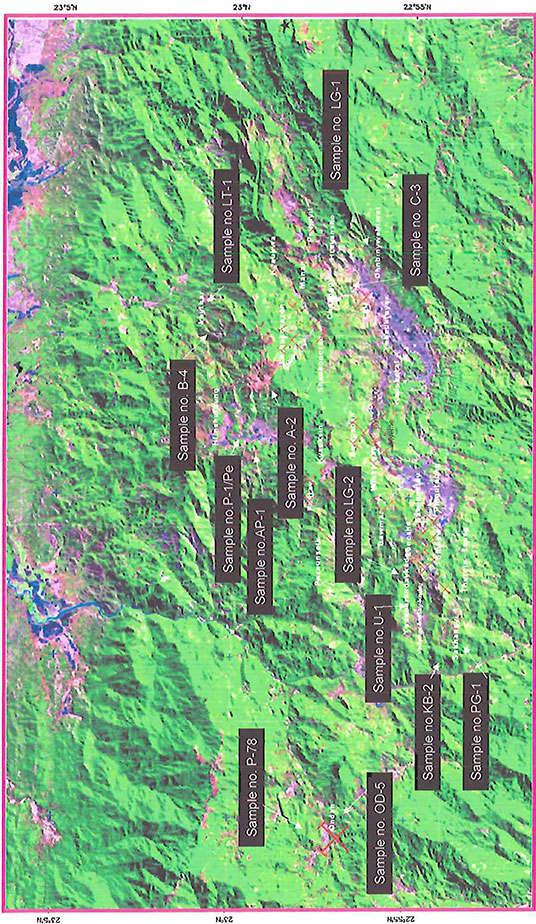 |
| Fig. 4.1. Sample location map of the Mogok Stone Tract (source; Landsat TM image, 30m resolution, band combination 754). (Note: Original is not legible at higher resolution) |
| Table 4.1. Chemical composition and norms of the igneous rocks from the Mogok area (in wt%). |
 |
| Table 4.1. Chemical composition and norms of the igneous rocks from the Mogok area (in wt%). (cont.) |
 |
| Table 4.1. Chemical composition and norms of the igneous rocks from the Mogok area (in wt%). (cont.) |
 |
| Table 4.1. Chemical composition and norms of the igneous rocks from the Mogok area (in wt%). (cont.) | |
| A-2 | Augite-biotite granite, 22° 58' 18.4" N, 96° 28' 8.5" E, peak of Taung-me Taung |
| P-78 | Augite-biotite granite, 22° 57' 33" N, 96° 14' 20" E, On-dan |
| LG-1 | Leucogranite, 22° 56' 32" N, 96° 32' 10" E, Ohn-bin-ywe-twet, East of Mogok |
| LG-2 | Leucogranite, 22° 54' 9.3" N, 96° 23' 55.6" E, Hin-thartaung, west of Kyat-pyin |
| KB-2 | Kabaing Granite, 22° 54' 32" N, 96° 21' 17" E, near Kabaing village |
| PG-1 | Pegmatite, 22° 54' 03" N, 96° 20' 46" E, Sakhan-gyi |
| AP-1 | Pegmatite, 22° 59' 55" N, 96° 27' 48" E, Pyaung-gaung |
| (46/711) | Augite granite, ENE of 4369', Kyauk-pyat-that area (from L.A.N. Iyer, 1953) |
| (46/723) | Kabaing Granite (from L.A.N. Iyer, 1953) |
| OD-5 | Sapphire-bearing nepheline syenite, 22° 57' 35" N, 96° 14' 18" E, north of Ondan |
| B-4 | Quartz monzonite, 23° 00' 26.3" N, 96° 30' 19.5" E, Lay-thar, north of Mogok |
| C-3 | Quartz syenite (foliated), 22° 56' 28.2" N, 96° 29' 43.5" E, north of Ohn-gaing |
| LT-1 | Sapphire-bearing alkali syenite pegmatite, 23° 00' 26.0" N, 96° 30' 20" E, JV mine of Lay-thar |
| (46/721) | Nepheline syenite, north of Kyauk-pyat-that (after L.A.N. Iyer, 1953) |
| (48/410) | Quartz syenite, west of Pyaung-gaung (after L.A.N. Iyer, 1953) |
| U-1 | Urtite, 22° 54' 34" N, 96° 22' 31" E, near Lone-sho |
| U-2 | Urtite, 22° 54' 12" N, 96° 22' 20" E, Thurein Taung |
| (46/181) | Urtite, Sinkhwa (after L.A.N. Iyer, 1953) |
| (46/710) | Hornblende rock, SE of Kyauk-pyat-that (after L.A.N. Iyer, 1953) |
| P-1 | Peridotite, 22° 58' 16" N, 96° 33' 11" E, UMEHL mine, Pyaung-gaung |
| Pe | Peridotite, 23° 00' 3.4" N, 96° 27' 54" E, NE of Pyaung-gaung |
| (48/409) | Peridotite, Bernard-myo (after L.A.N. Iyer, 1953) |
| (46/53) | Hornblende biotite norite, south of Gurka huts, ESE of Bernard-myo (after L.A.N. Iyer, 1953) |
4.3 Petrogenetic Interpretations
4.3.1 Nature and Chemical Changes in Igneous Differentiation
The igneous rocks of the area are mainly calc-alkaline and only partly alkaline. This is also evident from the bimodal distributions of the petrochemical data plots. According to the (Fig. 4.5 and 4.6), the value of alkali-lime index (Peacock index) is 55 for the igneous rocks of the area, indicating calcic to alkalic-calcic character in this area.
In the normative Ab-Or-An diagram (Fig. 4.9), most of the plots of augite-biotite granite, leucogranite, bioitite microgranite, pegmatite and syenitic rocks fall in the granite field. Hornblende rock, gabbro rock and urtite rocks fall in the tonalite field. However, the two groups may have belonged to two separate igneous events, because the igneous ages probably are different and there are no intermediate rock types present in the area. In the Al2O3-CaO-(Na2O+K2O) diagram (Fig. 4.8), most of the plots of the igneous rocks fall in the field of per-aluminous and, except urtite rocks, fall in the field of meta-aluminous.
Fe(T)-(Na2O+K2O)-MgO diagram, AFM diagram (Fig. 4.12) shows a rise of Fe(t) with the decrease of MgO during the initial stage of differentiation. In the later stage of differentiation, there is an increase of alkali with a depletion of Fe(t). ACF diagram (Fig. 4.13) and some distinctive chemical properties of the granitic rocks of the area indicate that these granitic rocks of are mostly S-type granites.
K2O-Na2O-CaO diagram (Fig. 4.14) indicates that in the initial stage of differentiation, there is an addition of K2O which is subsequently replaced by Na2O. CaO is decreased from the initial stage but stable in the later stage of differentiation. SiO2-Na2O-K2O diagram (Fig. 4.17) shows the chemical changes in the igneous rocks. It shows that in the later stage of magmatic differentiation Na2O decreases with an increases in K2O. Also, SiO2-(Na2O+K2O)-(FeOt+MgO) diagram (Fig. 4.16) pointed out that, a rise of SiO2 and a depletion of (FeOT+MgO) during the entire process of magmatic differentiation. Although, the contents of Na2O+K2O indicate no notable change.
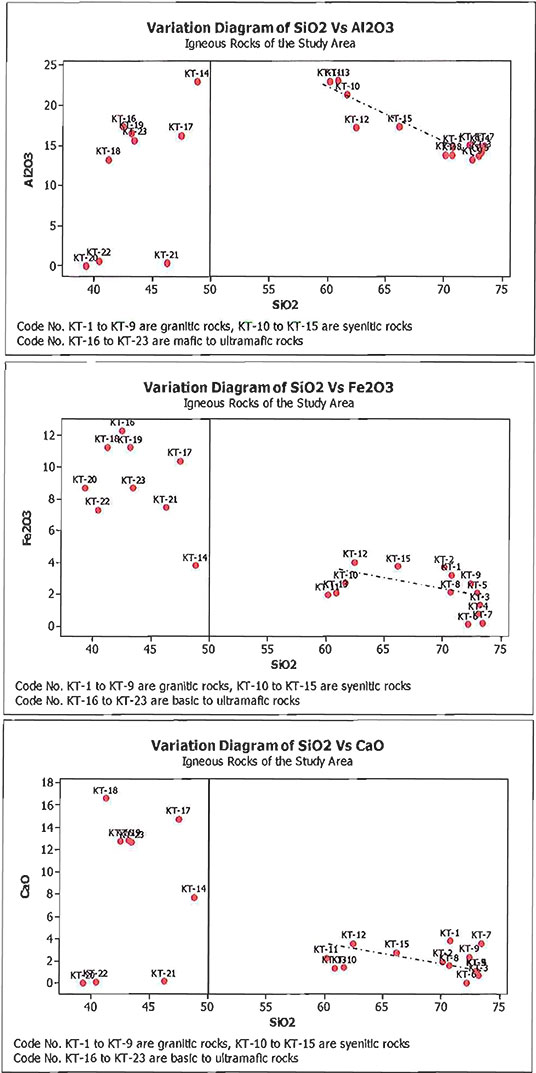 |
| Fig. 4.2. Variation diagram of major elements vs SiO2 in igneous rocks of the study area. |
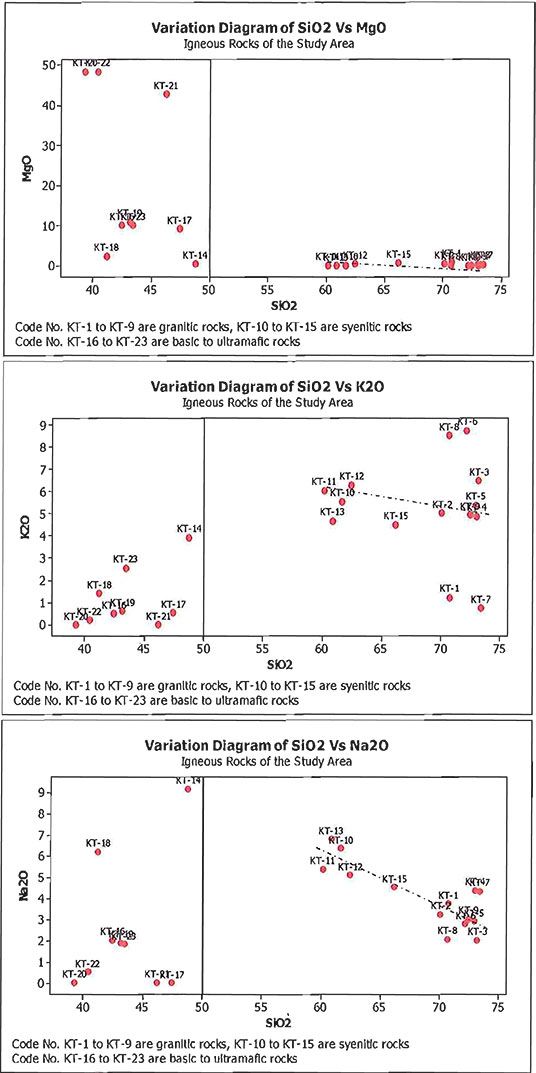 |
| Fig. 4.2. Variation diagram of major elements vs SiO2 in igneous rocks of the study area. (cont.) |
 |
| Fig. 4.5. Alkali-lime index diagram for igneous rocks of the area (Peacock index). |
 |
| Fig. 4.6. Alkali-lime index diagram for granitic, mafic and ultramafic rocks of the area (Peacock index). |
 |
| Fig. 4.8. Al2O3 — CaO — (Na2O+K2O) diagram. |
 |
| Fig. 4.9. Normative Ab-Or-An diagram for the igneous rocks of the study area, with dividing lines according to O’Connor (1965). |
 |
| Fig. 4.12. Fe(t)-Na2O+K2O-MgO (AFM) diagram, in terms of alkalis, total Fe and Mg for the igneous rocks of the area. |
 |
| Fig. 4.13. ACF diagram for the granitoids of the area (after Hyndman, 1985); Molar ratio: A = Al2O3–Na2O–K2O, C = CaO, F = Fe2O3+MgO. |
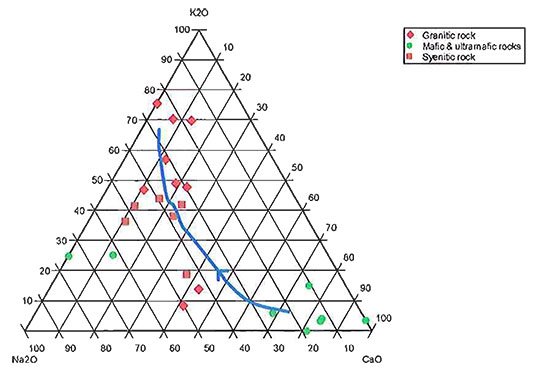 |
| Fig. 4.14. K2O–Na2O–CaO diagram. |
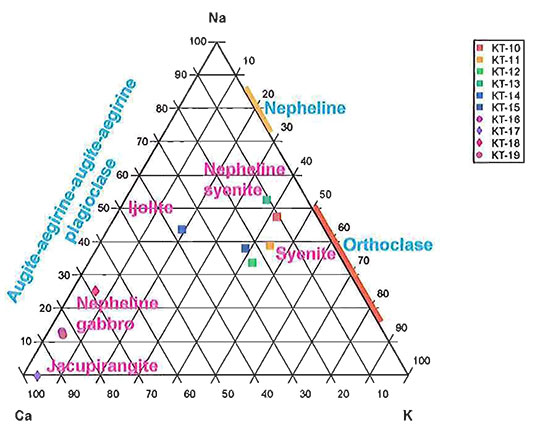 |
| Fig. 4.15. General Ca – Na – K compositional difference between the main kinds of alkaline igneous rocks; rocks become more mafic rich towards the Ca corner of the diagram (after Hyndman, 1985). |
4.3.2 Conditions of the Crystallization of the Igneous Rocks
As already shown in Fig. 4.9, the bulk composition of igneous rocks in the area ranges from granite to peridotite, but majority of the rocks falls in the granite field. All the analysed rocks, except ultramafic, mafic and urtite series, contain greater than 40% normative Ab+Or+Qtz. These ratios are plotted in ternary diagram (Fig. 4.18) with the quartz -feldspar boundaries at water pressures of 2 kb and 10 kb are shown projected onto the anhydrous base of the tetrahedron, after Tuttle and Bowen (1958). The dashed line represents the Ab/An piercing points projected onto the plane Ab-Or-Qtz at 5 kb water pressure (Wiebe, 1974).
According to Fig. 4.18, the points of augite-biotite granite and leucogranite lie between the ternary minimum of 2 kb and 10 kb , and the the two points of biotite microgranite and one point of leucogranite lie at the 5 kb curve of Wiebe (1974). Alkaline rocks and some points of pegmatite lie outside the ternary minimum, and it is in the field of albite and quartz-orthoclase. Assuming PH2O = Ptotal, the minimum PH2O allowed by the scattered points are 2 kb and 5 kb respectively. If the igneous rocks were assumed as crystallization at minimum pressure of 2 kb, their liquidus temperatures could have been cogitated from the diagram showing the relationships between differentiation index and temperature at 2 kb water pressure (Fig 4.19). From this diagram, the liquidus temperatures are: 650°C for pegmatite, 680°C for leucogranite, 690°C for biotite microgranite, 700°C for augite-biotite granite, 700–720°C for syenitic rocks, 785°C for urtite rocks, 950°C for gabbro, and 1180°C for peridotite.
Assuming that they were emplaced at PH2O of 10 kb, the temperature of crystallization of the rocks would become considerably lower. Depth of crystallization of the igneous rocks from the study area can be deduced from the schematic depth temperature relation diagram (Fig 4.21).
In K2O mol. vs Na2O mol. variation diagram (Fig. 4.20), the plots of augite-biotite granite fall within the field of syn-kinematic granite, but leucogranite, biotite microgranite and pegmatite fall within the field of late-kinematic granite.
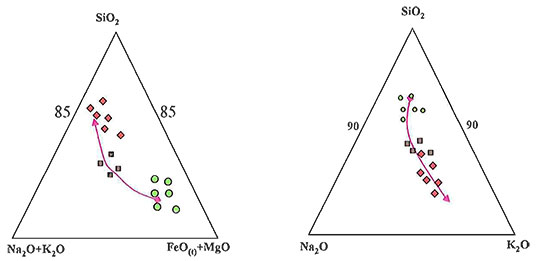 |
| Fig. 4.16. SiO2–(Na2O+K2O)–(FeO(t) + MgO) diagram. Fig. 4.17. SiO2–Na2O–K2O diagram. |
 |
| Fig. 4.19. Temperature-differentiation index diagram for the igneous rocks of the area, at 2 kb water pressure (after Piwinskii and Wyllie, 1970). |
 |
| Fig. 4.20. K2O mol. vs Na2O mol. variation diagram of granitic rocks in the area, showing the fields of syn-kinematic and late-kinematic granites (after Marmo, 1956). |
 |
| Fig. 4.21. Schematic depth-temperature relation diagram (after Marmo, 1956). |
Thus concludes Chapter IV. Access Chapter V here.
References follow.
References
Adams, E.D., 1926. A visit to the gem districts of Ceylon and Burma. Bull. Can. Inst. Min. Met. v. 166, pp. 213–246.
Barley, M.E, A.L. Pickard, Khin Zaw, P. Rak and M.G. Doyle, 2003. Jurassic to Miocene magmatism and metamorphism in the Mogok metamorphic belt and the Indian-Eurasia collision in Myanmar. Tectonics, v.22, no.3, pp. 1–11.
Bender, F. 1983. Geology of Burma. Gebruder Borntraeger, Berlin, 293 pp.
Bertrand, G, C. Rangin, H. Maluski, Tin Aung Han, Myint Thein, Ohn Myint, Win Maw and San Lwin, 1999. Cenozoic metamorphism along the Shan scarp (Myanmar): evidences for ductile shear along the Sagaing fault or the northward migration of the eastern Himalayan syntaxis. Geophysical Research Letters, v. 26, pp. 915–918.
Bertrand, G., C. Rangin, H. Mluski, H. Bellon and GIAC Scientific Party, 2001. Diachronous cooling along the Mogok Metamorphic Belt (Shan scarp, Myanmar): the trace of the northward migration of the Indian syntaxis. Journal of Asian Earth Sciences, v.19, pp. 649–659.
Brown, C.B. and J.W. Judd, 1896. The rubies of Burma and associated minerals; their mode of occurrence, origin and metamorphoses: a contribution to the history of corundum. Philosophical Transaction of the Royal Society of London. Series A, v. 187, pp. 151–228.
Brook, M., and N.J. Snelling, 1976. K/Ar and Rb/Sr age determinations on rocks and minerals from Burma. Inst. Geol. Sci., London, Isotope Geol. Unit Report 76/12, p.20.
Buddington, A.F., 1959. Granite emplacement with special reference to North America, Geol. Soc. Am. Bull., v. 70. pp. 671–747.
Cerny, P., 1991. Rare-element granitic pegmatite: regional to global environments and petrogenesis. Geosci. Can., v. 18, pt. 2, pp. 68–81.
Chappell, B.W. and A.J.R. White, 1974. Two contrasting granite types. Pacific Geol., v. 8, pp. 173–174.
Clegg, E.L.G. 1941. The Cretaceous and associated rocks of Burma. Mem. Geol. Surv. India, v. 74, pt.1, 101 pp.
Cobbing, E.J., P.E.J. Pitfield, O.P.E. Darbyshire and D.J.J. Mallick, 1992. The granites of the South-East Asian tin belt. Overseas Memoir, British Geological Survey, London, no. 10, 369 pp.
Fermor. L.L., 1932. The Mogok Stone Tract, Katha District. Rec. Geol. Surv. India, v. 65, pt. 1, pp. 80–86.
Hatch, F.H, A.K. Wells and M.K. Wells, 1961. Petrology of the igneous rocks, Thomas Murby, London, 514 pp.
Heron. A. M., 1937, Age of Mogok series, Rec. Geol. Surv. India, v. 72, pt. 1, pp. 62–64.
Hla Kyi, T. Themelis and Kyaw Thu, 2005. The pegmatitic gem deposits of Molo (Momeik) and Sakhan-gyi (Mogok). The Australian Gemmologist, v. 22, no. 7, pp. 303–309.
Hutchison, C.S., 1975. The norm, its variations, their calculation and relationships. Sch. Min. Pet., Mitt., v. 55, pp. 243–256.
Hyndman, D.W, 1985. Petrology of igneous and metamorphic rocks. New York, McGraw-Hill. 2nd edt., 786 pp.
Irvine, T.N. and W.R.A. Barager, 1971. A guide to the chemical classification of the common volcanic rocks. Can. Jour. Earth Sci., v. 8, pp. 523–548.
Iyer, L.A.N., 1953. The geology and gemstones of the Mogok Stone Tract, Burma. Mem. Geol. Surv. India, v. 82, pp. 100.
Kerkvoort, G.V., 1995. Rare metal granitic pegmatites. Unpublished B.Sc. Hons. Thesis, University of Tasmania, Australia, 70 pp.
Khin Zaw, 1986. Geological, petrological, and geochemical characteristics of granitoid rocks in Burma: with special reference to the emplacement of W-Sn mineralisation and their global tectonic implications. Unpublished research paper.
Khin Zaw, 1998. Geological evolution of selected granitic pegmatites in Myanmar (Burma): constraints from regional setting, lithology, and fluid-inclusion studies. International Geology Review, v. 40, pp. 647–662.
La Touche, T.H.D., 1913. Geology of the northern Shan States. Mem. Geol. Surv. India, v. 39, pt. 2, 379 pp.
Maniar, P.D., and P.M. Piccoli, 1989. Tectonic discrimination of granitoids. Geol. Soc. Am. Bull., v. 101, pp. 635–643.
Marmo, A., 1956. On the emplacement of granites. Amer. Jour. of Sci., v. 254, pp. 479–492.
Maung Thein, 2000. Summary of the geological history of Myanmar. Unpublished paper, p.8.
Metcalfe, I., 1998. Origin and assembly of South-East Asia continental terranes. In: Audley Charles, M.G., Hallam, A. (Eds.), Gondwana and Tethys, Special publication Geological Society of London, v. 37, pp. 101–118.
Metcalfe, I., 2000. The Bentong-Raub suture zone. Journal of Southeast Asian Earth Sciences, v. 18, pp. 691–721.
Mitchell, A.H.G., 1977. Tectonic setting for emplacement of Southeast Asia Tin granites. Geological Society of London, v. 141, pp. 123–140.
Mitchell, A.H.G., 1992. Late Permian-Mesozoic events and the Mergui Group nappe in Myanmar and Thailand. Jour. of SE Asia Earth Sciences, v. 7, pp. 165–178.
Mitchell, A.H.G., 1993. Cretaceous-Cenzoic tectonic event in western Myanmar (Burma)—Assam region: Jour. of the Geol. Soc. London, v. 150, pp. 1089–1102.
Mitchell, A.H.G., C.A. Ausa, L. Deiparine, Tin Hlaing, Nyunt Htay and Aung Khine, 2004. The Modi Taung-Nankwe gold district, Slate Belt, central Myanmar: mesothermal veins in a Mesozoic orogen. Journal of Asian Earth Sciences, v. 23, pp. 231–341.
Mitchell, A.H.G., Myint Thein Htay, Kyaw Min Htun, Myint Naing Win, Thura Oo and Tin Hlaing, 2006. Rock relationships in the Mogok metamorphic belt, Tatkon to Mandalay, central Myanmar. Jour. of Asian Earth Sciences. doi:10.1016/j.jseaes.2006.05.009, pp.1–20.
Myint Lwin Thein, Ohn Myint, Sun Kyi and Phone Nyunt Win, 1990. Geology and stratigraphy of the metamorphosed Early Paleozoic rocks of the Mogok-Thabeikkyin-Singu-Madaya areas. Unpublished staff report, no. 98, A.G.D., Y.U., p.24.
O’connor, J.T., 1965. Classification of quartz-rich igneous rocks based on feldspar ratios. U.S.G.S. Prof. Paper. 525B, pp. 79–84.
Piwinskii, and P.J. Wyllie, 1970. Experimental studies of igneous rock series: felsic body suite from the Neddle point pluton, Wallowa Batholith, Oregon. Jour. Geol. v. 78, pp. 52–76.
Ridd, M.F., 1971. South-East Asia as a part of Gondwana land. Nature, v. 234, pp. 531–533.
Rossman, G.R., Saw Naung Oo, G.E. Harlow and J. Hunt, 2005. A second source in Myanmar and metasomatic origins. Goldschmidt Conference Abstract, Geochemistry of Gem Deposits Sec., pp. 278–279.
Searle, D.L. and Ba Than Haq, 1964. The Mogok belt of Burma and its relationship to the Himalayan orogeny. in Int. Geol. Cong., Twenty-Second Sec., India, Himalayan and Alpine orogeny, Sec. 11, pp. 132–161.
Sein Myint, Than Naing and Soe Nyunt Swe, 1979. Satellite imagery interpretation of major lineaments in part of northeastern Burma. Contribution to Burmese Geology, v. 1, no. 1. pp. 20–25.
Smirnov, V.I., 1976. Geology of mineral deposits. MIR Publishers, Moscow, 520 pp.
Sutherland, F.L., D. Schwarrz, E.A. Jobbins, R.R. Coenraads and G. Webb, 1998. Distinctive gem corundum suites from discrete basalt fields: a comparative study of Barrington, Australia, and West Pailin, Cambodia gem fields. Journal of Gemmology, v. 26, pp. 65–85.
Sylvester, P. J., 1989. Post-collision alkaline granites. Jour. of Geol., v. 97, pp. 261–280.
Thet Tin Nyunt, 2000. Mineralogical and petrological studies of Bemard-Pyaunggaung area, Mogok Township, Mandalay Division. Unpublished M.Sc. Thesis, University of Yangon, 184 pp.
Thuzar Aung, 2003. Petrology and Gemstones of Ondan and its Environs, Mogok Township, Mandalay Division. Unpublished M.Res. Thesis, University of Yangon, 90 pp.
Tuttle, O. F., and N.L. Bowen, 1958. Origin of granite in the light of experimental studies in the system NaAISip8-KAISiP8-Si02-H20. In: Hyundman, D.W., 1985. Petrology of igneous and metamorphic rocks. New York, McGraw-Hill. 2nd edt., 786 pp.
United Nations, 1978. Geology and exploration geochemistry of the Shan scarps area, east of Kyaukse, Thazi and Tatkon, central Burma. Technical Report. UN/BUR 721002, no. 3, United Nations Development Programme, New York.
Washington, H.S., 1917; Chemical analyses of igneous rocks published from 1884 to 1913, inclusive. U.S. Geol. Survey Prof. Paper, no. 99, pp. 9–1201.
Wiebe, R.A., 1974. Differentiation in layered diorite intrusions, Ingonish, Nova Scotia. Jour. Geol., v. 82, pp. 731–750.
Williams. H., F.J. Turner and C.M. Gilbert, 1982. Petrography; an introduction of the study of rocks in thin section. 2nd ed. W.H. Freeman and Co., San Francisco, 626 pp.
Win Naing, 2001. Tertiary deformation patterns of the northeastern part of Myanmar: structural and microfabric evidences from the Mogok-Momeik area. Unpublished M.Res. Thesis, Dept. of Geol., University of Yangon 198 pp.
Wright, J.B., 1969. A simple alkalinity ratio and its application to questions of non-orogenic granite gneiss. Geol. Mag., v. 106, pp. 523–548.